



State of charge (SOC) tells you how full a battery is. Depth of discharge (DoD) tells you how much of its capacity has been used. They describe the same battery from opposite directions.
If a battery is at 70% SOC, it has used about 30% of its capacity, so its DoD is about 30%. In a simple model:
SOC (%) + DoD (%) = 100%
These terms appear in battery apps, datasheets, warranties and backup settings. Understanding them helps you compare usable energy, plan outage runtime and avoid confusing nominal capacity with the energy you can use in normal operation.
What Is State of Charge?
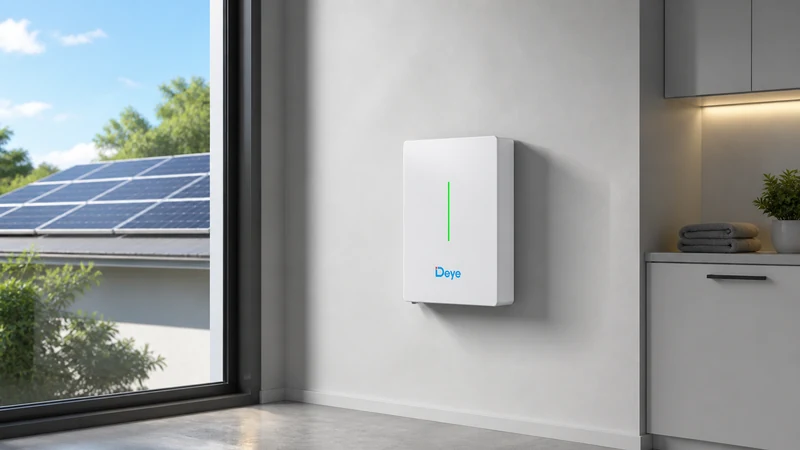
SOC is an estimate of the energy remaining in a battery, expressed as a percentage of its available full-charge reference.
- 100% SOC means the battery is at its configured full state.
- 50% SOC means roughly half of the tracked capacity remains.
- 10% SOC means the battery is close to its lower operating limit.
The word “estimate” matters. A battery management system cannot look inside a cell and directly count the energy that remains. It calculates SOC using measurements such as current, voltage and temperature, along with a model of the battery. Accuracy can change with calibration, cell balance, aging and operating conditions.
For owners, SOC is the most useful day-to-day number. It answers a simple question: how much battery energy is left?
What Is Depth of Discharge?
DoD is the percentage of battery capacity removed during discharge. If a full battery supplies 60% of its tracked capacity, that event reaches 60% DoD and leaves about 40% SOC.
Manufacturers often use DoD to state the recommended operating window. A battery with a recommended 90% DoD is generally designed to make up to about 90% of its nominal energy available under the stated conditions, while retaining a lower reserve that helps protect the battery and maintain control functions.
Do not assume that a higher DoD is always better. It gives more usable energy from a given nominal capacity, but cycle life, warranty conditions, power limits and backup strategy must be considered together.
SOC and DoD Examples
| Battery condition | Approximate SOC | Approximate DoD |
|---|---|---|
| Fully charged | 100% | 0% |
| One-quarter used | 75% | 25% |
| Half used | 50% | 50% |
| Four-fifths used | 20% | 80% |
| Nine-tenths used | 10% | 90% |
The relationship is simple in percentage terms. Actual energy is more complicated because battery capacity changes with temperature, power, age and system losses.
Nominal Energy vs Usable Energy
Nominal energy is the battery’s headline capacity under specified test conditions. Usable energy is the portion made available within the approved operating window.
For a simplified estimate:
Usable energy = nominal energy × permitted DoD
For example, a 10.24 kWh battery operated at 90% DoD would provide:
10.24 kWh × 0.90 = 9.216 kWh
Rounded, that is about 9.2 kWh. The Deye RW-F10.2-B lists 10.24 kWh nominal energy and 9.2 kWh usable energy, which illustrates this relationship.
Energy delivered to appliances will be lower than battery-side usable energy because conversion and wiring have losses. Backup runtime also depends on inverter limits and load behavior.
How SOC Settings Affect Backup Power
Many energy storage systems allow an owner or installer to maintain a minimum SOC reserve. If the minimum is set to 20%, the system normally stops discretionary discharge around that level and preserves energy for backup or battery protection, depending on the operating mode.
A larger reserve offers more protection if the grid fails, but it reduces the capacity available for time-of-use savings or solar self-consumption. A smaller reserve makes more energy available every day, but the battery may have less left when an unexpected outage begins.
The right setting depends on:
- How often and how long grid outages occur.
- Which loads need backup.
- Whether solar can recharge the battery during an outage.
- Electricity tariffs and demand charges.
- Weather and seasonal solar production.
- Manufacturer and warranty requirements.
This is a policy choice as much as a technical setting. A hospital, home office and tariff-optimization project may use very different reserves.
How DoD Affects Cycle Life
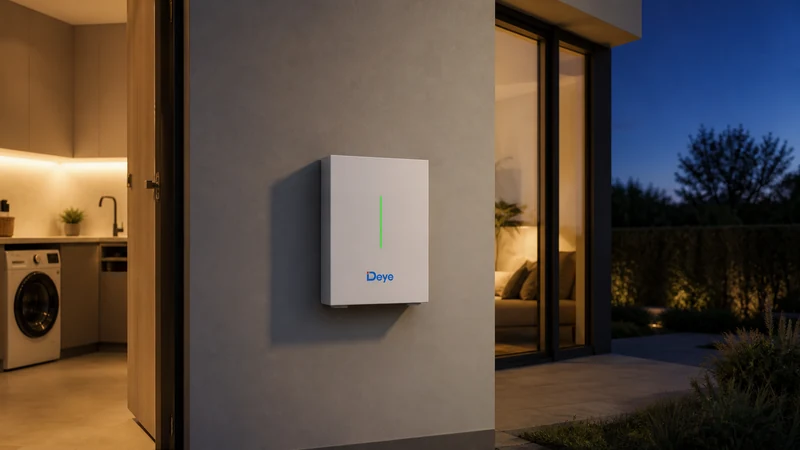
A cycle is not always one trip from 100% to 0%. Battery use is often counted as equivalent full cycles. Two discharges of 50% can add up to roughly one equivalent full cycle.
Deeper cycling usually places more stress on a cell than shallow cycling, but there is no universal “perfect” DoD for every lithium battery. Chemistry, cell design, temperature, charge and discharge rate, time at high SOC, and control strategy all affect aging.
Use the specific product’s published test conditions when comparing cycle-life claims. For example, the Deye SE-G5.1 Pro-B states a recommended 90% DoD and publishes cycle life under defined temperature, rate and end-of-life conditions. A cycle figure without its test conditions is not a complete comparison.
Why the Displayed SOC Can Change Unexpectedly
Owners sometimes see SOC rise or fall by several percentage points after a restart, calibration cycle or temperature change. This does not necessarily mean energy appeared or disappeared. The BMS may be improving its estimate.
Common influences include:
- Cell balancing near the top of charge.
- Battery temperature changing after a heavy load.
- Long periods without reaching a calibration point.
- Capacity loss as the battery ages.
- Communication or configuration issues between battery and inverter.
Follow the product instructions for calibration. Do not manually force a deep discharge in an attempt to “reset” a lithium battery unless the approved procedure specifically requires it.
Common SOC and DoD Mistakes
Treating 0% SOC as a Physically Empty Cell
The displayed 0% is normally a controlled lower limit, not a cell with absolutely no electrochemical energy. Hidden protection margins help prevent damage.
Comparing Nominal Capacity with AC Load Energy
A 10 kWh battery will not necessarily deliver 10 kWh to appliances. Account for DoD, conversion efficiency, standby use, temperature and aging.
Changing Limits Without Checking the Warranty
Operating outside recommended settings may affect performance, safety or warranty coverage. Use approved parameters and qualified support.
Ignoring Power
Energy in kWh tells you how long a battery may run a load. Power in kW tells you whether it can run that load at all. A battery may have enough energy for several hours but still be unable to support a large startup surge.
Use Both Metrics to Plan a Better System
SOC is the clearest measure of what remains now. DoD describes how much of the battery’s capacity you use. Together with nominal energy, usable energy, power and efficiency, they provide a practical picture of system capability.
Explore the Deye residential ESS solution to see how storage, solar and backup can be coordinated around household energy needs.
Need help turning your load profile into the right battery capacity and reserve setting? Complete the inquiry form on the Deye ESS Contact page. Share your country, daily energy use, peak load, existing solar size, required backup hours and preferred reserve. The team can use those details to discuss an appropriate residential or commercial storage configuration.