



Commercial battery storage ROI is calculated by comparing the project’s lifetime net cash benefits with its total installed and operating costs. A credible model includes more than equipment price and annual electricity savings: it should use interval load data, actual tariff rules, dispatch constraints, degradation, maintenance, financing, taxes, incentives, and replacement assumptions.
The result is not one universal percentage. It is a range shaped by the site, market, operating strategy, and contract structure.

Define the investment decision first
Start by stating what the battery is expected to do. Common objectives include:
- reducing demand charges through peak shaving;
- charging off-peak and discharging during expensive tariff periods;
- increasing on-site solar consumption;
- limiting export or avoiding renewable curtailment;
- providing resilience for selected loads;
- supporting EV charging without immediately increasing grid capacity; and
- participating in approved grid-service or flexibility programs.
Each objective needs a different dispatch model. Adding every possible revenue stream without testing operational conflicts will overstate value. A battery reserved for backup, for example, has less energy available for daily tariff optimization.
Step 1: Build the installed-cost baseline
Use the complete capital cost, not the battery cabinet price alone. Include:
- battery and power conversion equipment;
- EMS, meters, controls, and communications;
- switchgear, transformer, protection, and cabling;
- engineering, permitting, civil works, and installation;
- grid studies and interconnection charges;
- commissioning, training, and initial spares; and
- taxes or duties where applicable.
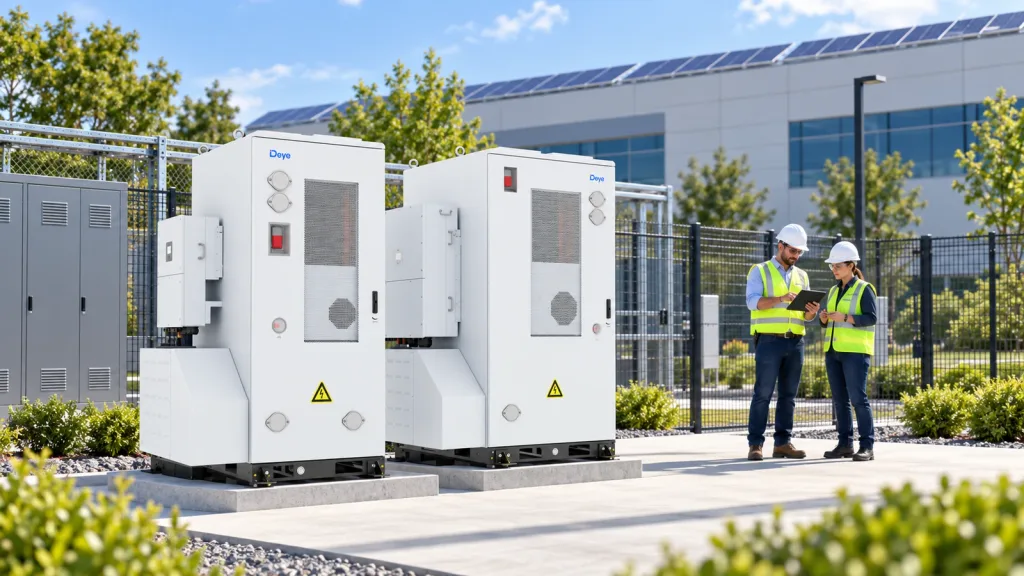
Deye’s C&I ESS Solution provides routes for commercial and industrial applications. Product selection should follow the required power, energy, grid mode, site environment, and market documentation—not a target payback period alone. The GE-F128, GE-F240 and GE-F256 page is one product route for projects evaluating integrated C&I storage configurations.
Step 2: Model the annual value streams
Energy arbitrage
Calculate the energy purchased or stored during lower-cost periods and discharged to avoid higher-cost purchases. The gross tariff spread must be adjusted for round-trip losses and any charging demand impact.
Demand-charge reduction
Use 15-minute, 30-minute, or utility-specific billing intervals to simulate the battery against the site load. Savings depend on whether the system can consistently reduce the billing peak, not on the highest instantaneous spike.
Solar self-consumption
Value discharged solar energy against the grid electricity it replaces. If exported solar already receives compensation, the incremental value is the avoided retail price minus the export value, adjusted for losses.
Resilience
Avoided outage cost can be important, but it should not be treated as guaranteed annual income. Estimate event probability, critical-load losses, restart costs, spoiled material, and service interruption. Report resilience value separately or apply a probability-weighted method.
Market services
Include capacity, demand response, or ancillary-service revenue only when the project has a viable route to participate. Deduct aggregator fees and consider availability, telemetry, performance, and cycling obligations.
Step 3: Deduct annual operating costs
Typical items include preventive maintenance, software or communications fees, insurance, inspections, auxiliary electricity, service contracts, financing costs, and planned component replacement. Model augmentation or end-of-life replacement only when supported by the project design and commercial terms.
Battery degradation matters because the same dispatch plan may not be possible every year. Use the warranted operating window and throughput conditions for the selected system, then model usable capacity over time. Do not assume that nameplate energy remains constant for the full project life.
Step 4: Calculate the core metrics
Simple payback
Simple payback = initial net investment ÷ first-year net cash benefit
This is easy to communicate but ignores the time value of money, degradation, changing tariffs, and later costs.
Return on investment
One common project-level expression is:
ROI = (total lifetime benefits − total lifetime costs) ÷ total lifetime costs × 100%
State the time period and whether financing and tax effects are included, because organizations use different ROI conventions.
Net present value
NPV discounts each future net cash flow to today:
NPV = sum of discounted annual net cash flows − initial investment
A positive NPV means the modeled project exceeds the chosen discount-rate threshold. The discount rate should reflect the owner’s cost of capital and project risk.
Internal rate of return
IRR is the discount rate at which NPV equals zero. It is useful for comparing investments, but it should be reviewed alongside NPV, cash-flow timing, and project scale.
A simplified illustrative example
Assume a project has an installed cost of $500,000 and an incentive of $50,000, producing a net initial investment of $450,000. Modeled first-year benefits are $105,000, while maintenance, software, and other operating costs total $15,000. First-year net benefit is therefore $90,000.
The simple payback is:
$450,000 ÷ $90,000 = 5 years
This does not prove that the project will return its cost in five years. A bankable model must recalculate annual cash flow with degradation, tariff escalation, dispatch limits, downtime, financing, taxes, and any later capital expense. The figures above are hypothetical and are not a savings forecast for a Deye product or a specific site.
Step 5: Run sensitivity cases
At minimum, compare conservative, base, and upside cases. Test:
- lower and higher tariff spreads;
- different demand-growth assumptions;
- reduced PV production;
- lower battery availability;
- faster or slower degradation;
- changes in export compensation;
- delayed commissioning;
- financing-rate changes; and
- a reserve requirement for backup.
A good model shows which two or three variables control the result. If a small tariff change makes NPV negative, the owner should know before procurement.
Use interval simulation, not an annual average
Commercial demand charges and battery constraints are time-dependent. Model the site at the utility billing interval for at least one representative year. The simulation should respect power limits, usable energy, SoC boundaries, efficiency, reserve, and charge/discharge availability.
An EMS can coordinate these operating priorities. Deye’s MS-EMS is a relevant product route when evaluating system-level control; the project team should confirm the required functions and interfaces for the selected architecture.
FAQ
What is a good ROI for commercial battery storage?
There is no universal threshold. Owners should compare the project’s NPV, IRR, payback, risk, and strategic resilience value with their own investment criteria.
Which data is needed for a reliable calculation?
Use interval load and PV data, complete tariffs, bills, export rules, outage requirements, equipment assumptions, installed costs, maintenance terms, financing inputs, and the proposed dispatch policy.
Should incentives be included in ROI?
Yes, when eligibility and timing are sufficiently certain. Show the result with and without incentives so the decision is not dependent on an unconfirmed benefit.
How should degradation be modeled?
Use product-specific warranted capacity, throughput, operating conditions, and dispatch assumptions. Reduce usable energy or revenue over time and include augmentation only when planned.
Can resilience be converted into an annual saving?
It can be estimated using outage probability and consequence, but it is not the same as recurring tariff revenue. Keep the assumption transparent and test it separately.
Turn the business case into a project brief
Evaluating a commercial battery investment? Contact Deye ESS with 12 months of interval data, electricity bills, tariff and export rules, PV profile, critical loads, site location, operating schedule, and required project life. These inputs allow the technical and financial cases to be tested together.